A few months ago we published a blog highlighting the work of Billy Beane (GM for the Oakland A’s), as reported through the lens of the fascinating book, Moneyball. Sports Illustrated referenced the book in a recent article:
“The book is about how Athletics G.M. Billy Beane and the Oakland A’s exploited market inefficiencies by incorporating a statistics-based approach to running a baseball team. The undervalued asset in the late ’90s and early 2000s was on-base percentage; the small-market A’s, kings of OBP, won at least 91 games in five straight seasons.”

This article is a must read for any serious business owner, as it details the importance of constant surveillance for improved efficiencies to stay ahead of the competition. Here are some excerpts from this eye opening article:
“In Moneyball’s aftermath OBP became valued—perhaps even overvalued—by teams, but by then the A’s and a handful of other front offices in baseball had turned to the next inefficiency: defense…
Seattle scored an American League–low 640 runs in 2009. The team was last in on-base percentage, second-to-last in slugging and tied for 11th in home runs. Yet the Mariners won 85 games, a 24-win jump from ’08, the largest improvement in baseball. No team in the history of the AL had scored so few runs and won so many games. Of all the teams since 1893 with a winning record, only two (the 1913 White Sox and the 2003 Dodgers) had scored fewer runs relative to the league average, according to sabermetrician Tom Tango, author of The Book: Playing the Percentages in Baseball and a consultant to the Mariners.”
Assistant G.M. in Seattle, Jeff Kingston states:
“[Seattle] won games because they were first in the league in run prevention, but other than Felix Hernandez, you really didn’t know who else was on the pitching staff… You wondered: How were they so good with a bunch of people you’ve never heard of?”
The reason?
“The Mariners were Death to Things Hit in Play. According to John Dewan, author of The Fielding Bible, a publication devoted to defensive statistical analysis, the Mariners defense last year saved a staggering 110 runs, 45 more than any other team and the most by any club since Dewan began tracking defensive data in 2003. Seattle’s season was the answer to a riddle: In an era when power and on-base percentage were paramount, just how bad can you be at scoring runs and still be a successful team? The answer: When you have wizards like Franklin Gutierrez in the outfield, you can be the worst offensive team in the league…
[The story of the shift in Major League Baseball from valuing on-base percentage to valuing defensive analysis] begins in 2004 at baseball’s trade deadline, when the Red Sox, in the midst of a three-month .500 funk, unloaded Boston icon Nomar Garciaparra in a trade that netted them a Gold Glove shortstop (Orlando Cabrera), a Gold Glove first baseman (Doug Mientkiewicz) and an above-average outfielder (Dave Roberts). Three months later, the Red Sox were dancing in St. Louis, celebrating a World Series championship…

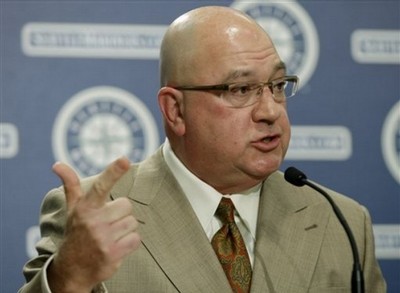
Jack Zduriencik, who in October 2008 inherited a franchise coming off a disastrous season (the Mariners that year were the first team in history to lose 100 games with a $100 million payroll), has been hailed as the second coming of Billy Beane. (Among the headlines in the baseball blogosphere this winter: MONEYBALL II: ATTACK OF THE ZDURIENCIK!)…
‘Defense might be the new OBP,’ says [Assistant Director of Amateur Scouting], Tony Blengino…’but at some point it’s going to be something else that will be underappreciated. Who knows what the next inefficiency in the marketplace is going to be.’
But the shift hasn’t happened yet. The defensive revolution is still young. And the Mariners will ride the wave as long as they can. ‘We’re not smarter than anyone else, I can promise you that,’ says Zduriencik. ‘But I can promise that we’ll always be trying to find that edge. We’ll always try to be a step ahead.'”
A few days ago, I spoke to the Director of recruiting at one of the largest real estate companies in the nation. After some discussion, I asked her three questions:
- What is the ratio of candidates contacted to interviews with managers?
- What is the percentage of actual hires converted from managers’ interviews?
- What is your total cost per hire?
She didn’t begin to know how to answer any of these questions. My guess is that they will not stay a “step ahead.”
This story drives the point again: Measure everything – and be unrelenting in improving inefficiencies.
So long for now… I have to buy my tickets for those Mariners games…
Editor’s Note: This article was written by Dr. David Mashburn. Dave is a Clinical and Consulting Psychologist, Partner at Tidemark, Inc. and a regular contributor to WorkPuzzle. Comments or questions are welcome. If you’re an email subscriber, reply to this WorkPuzzle email. If you read the blog directly from the web, you can click the “comments” link below.

